Learning Python/Kaggle
Python is a versatile programming language known for its simplicity and efficiency in various applications, including data visualization. The graphs below are examples of how I utilized this program in KNES 381 and other classes this semester.
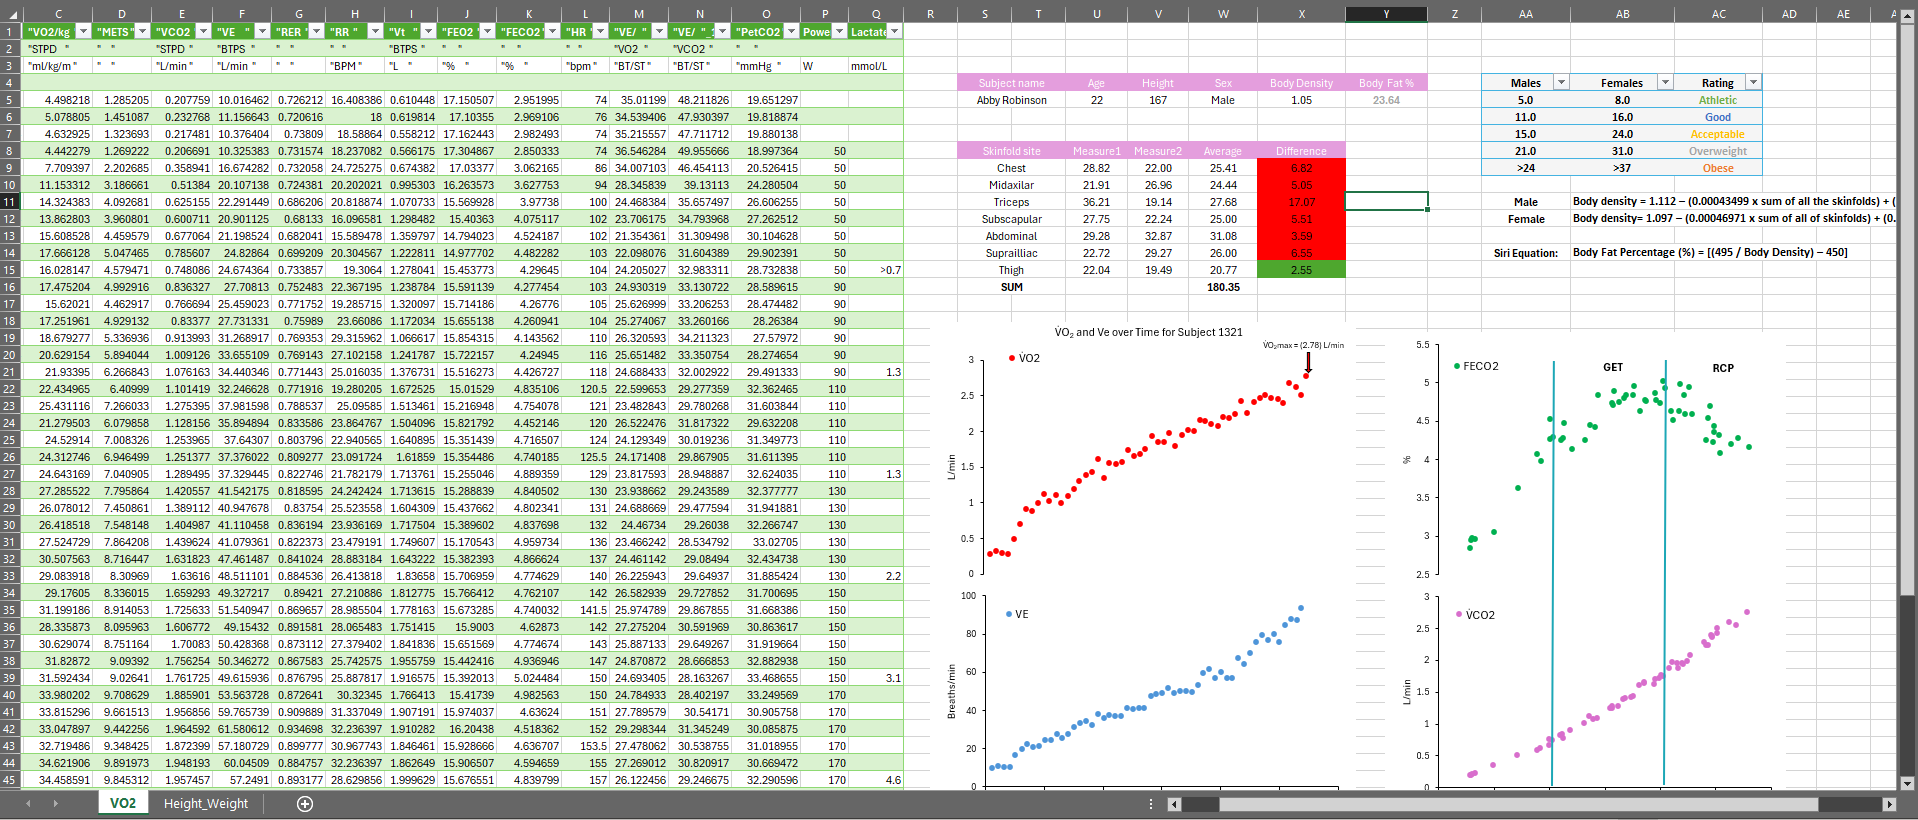
By simply creating this code in Kaggle, I was able to create a high-quality threshold graph for the VO2 data provided in KNES 381.
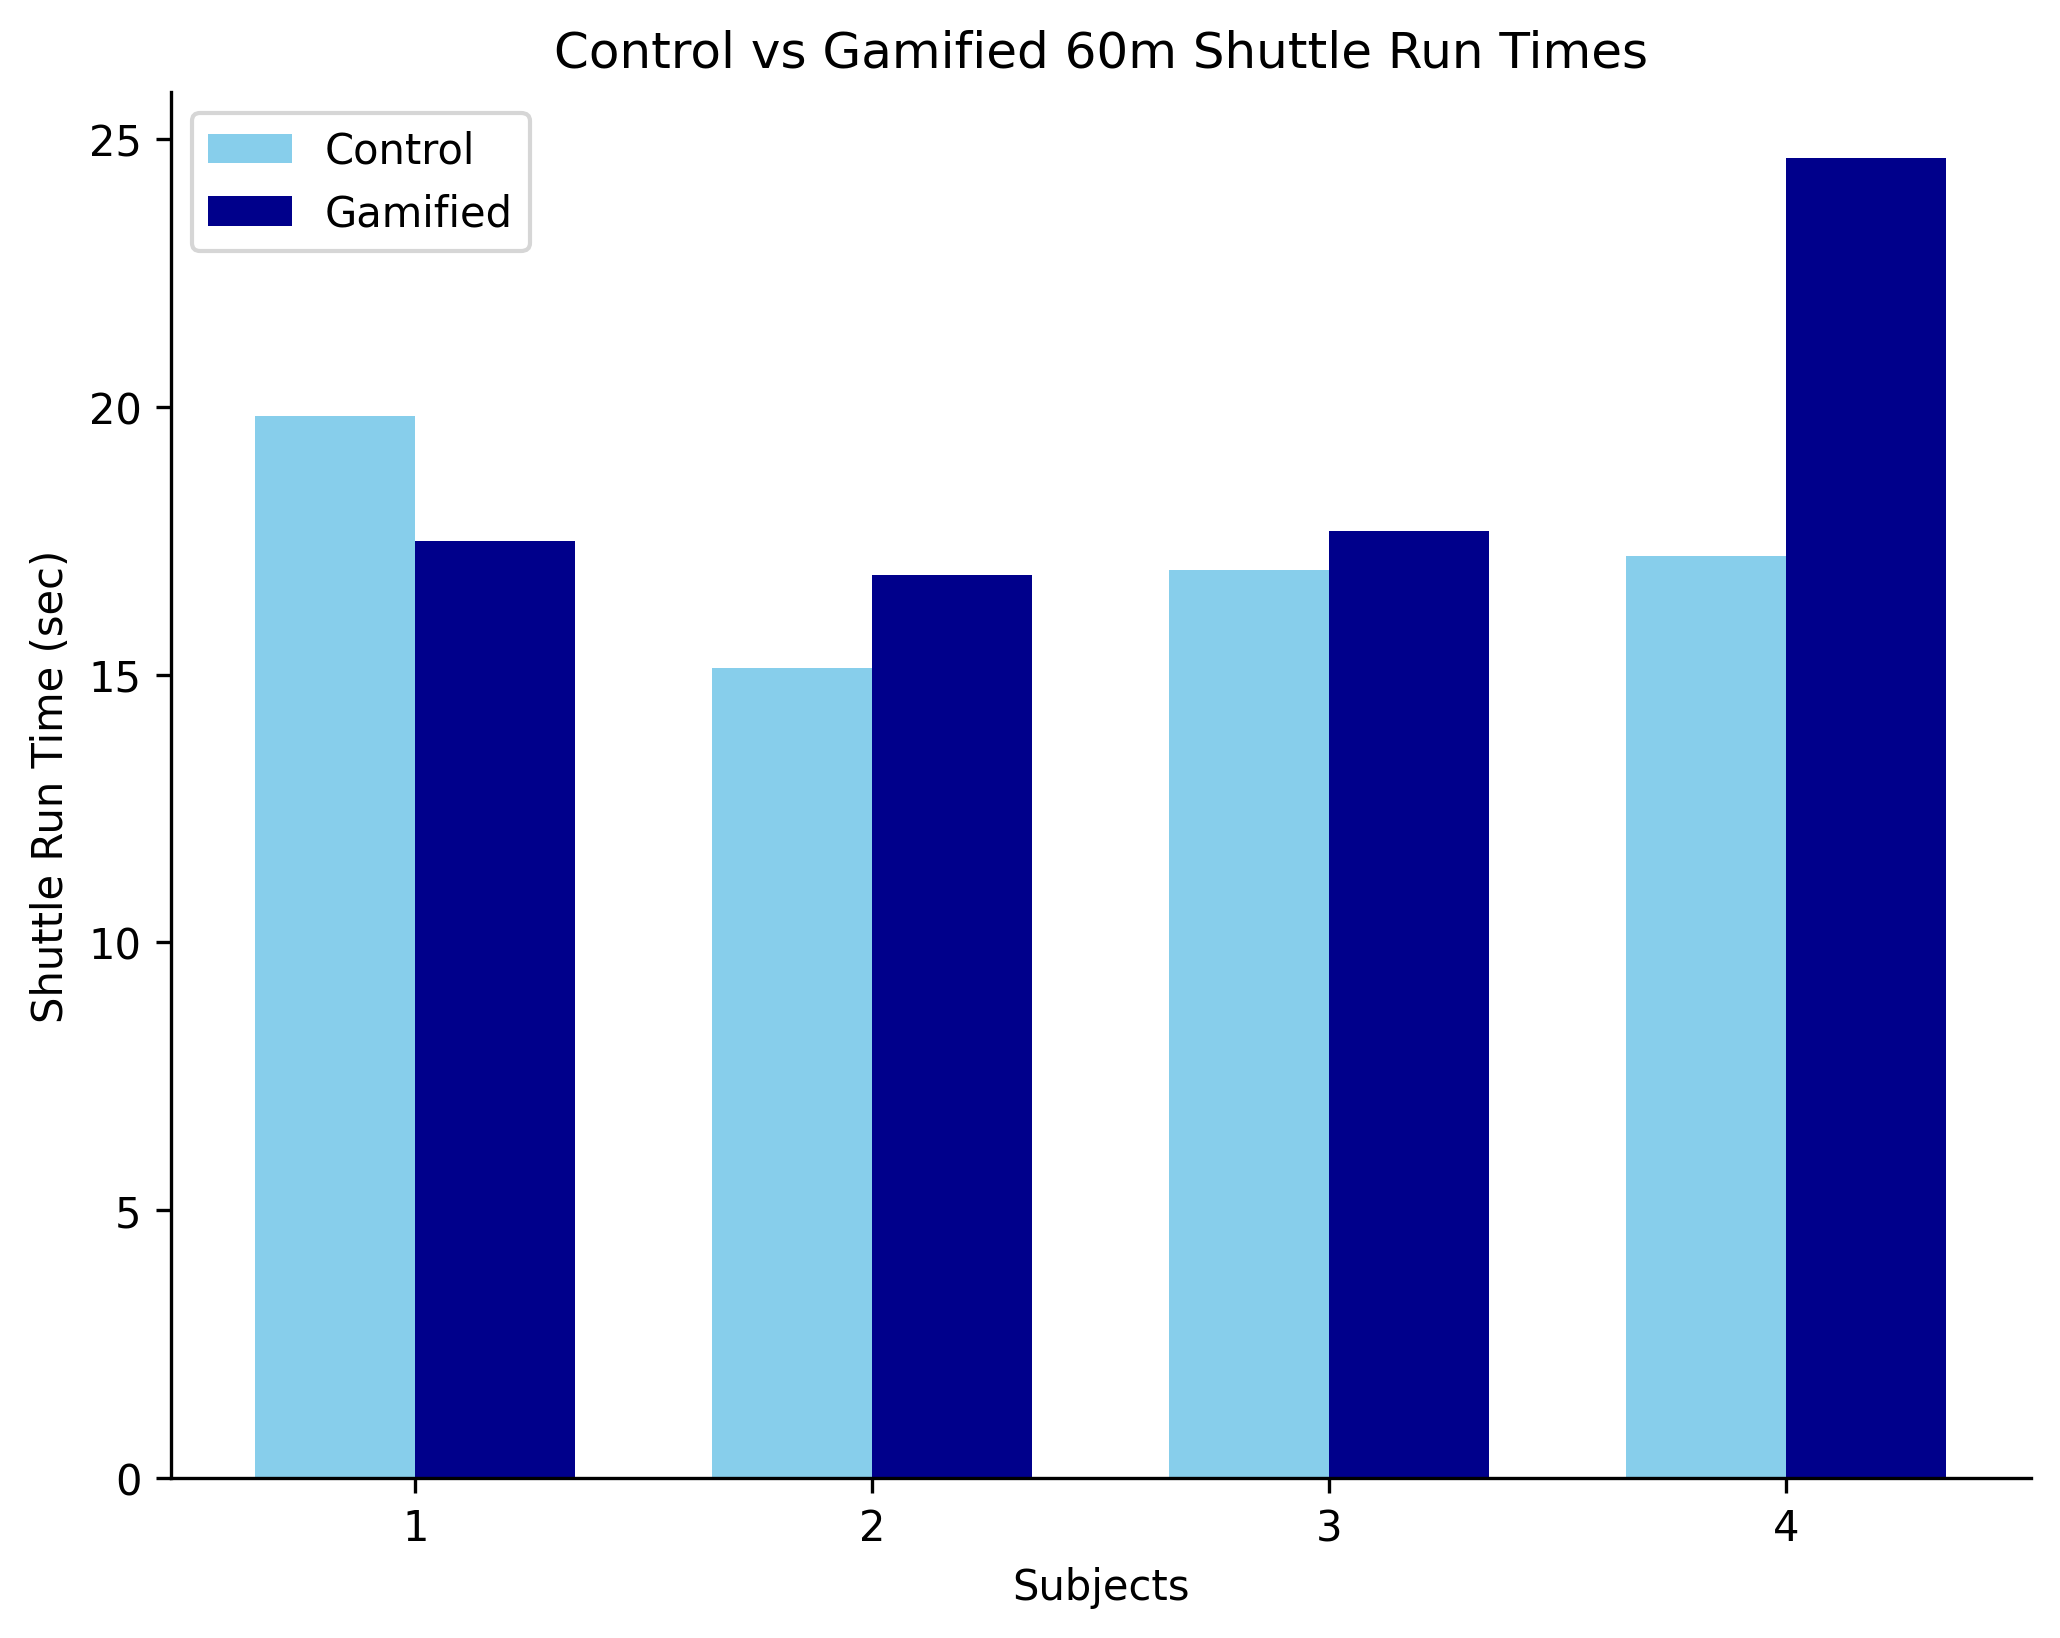
Additionally, I used Kaggle to create a bar graph for another class, helping me organize my testing data across two trials!
Using Excel
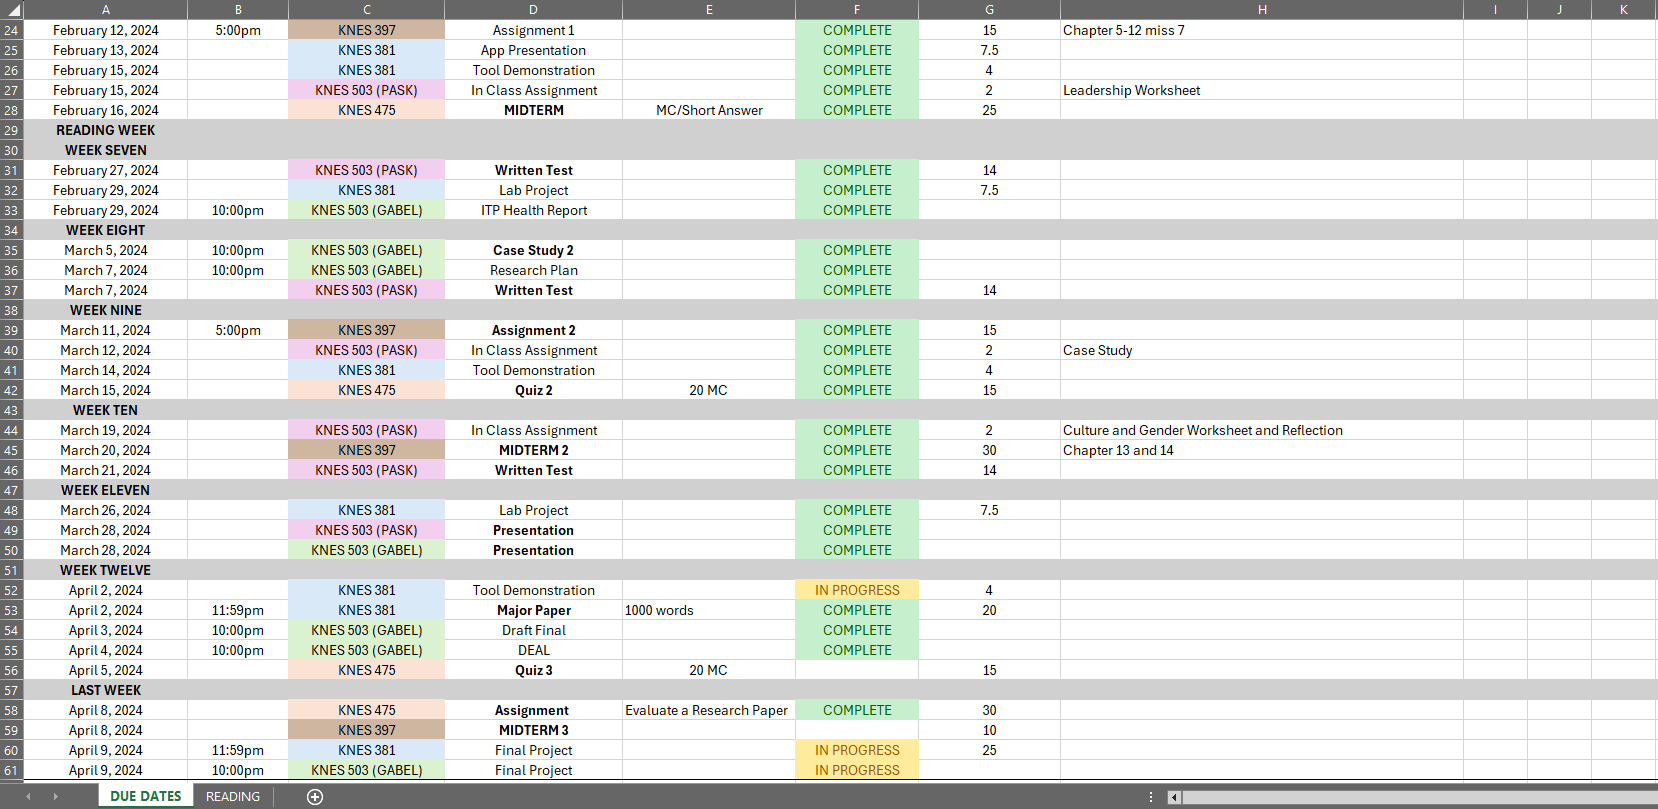
Throughout my university experience I gained considerable proficiency in Excel as it was a fundamental tool for many assignments. Additionally, I personally explored and mastered various Excel tools over the years, utilizing them for tasks such as tracking deadlines and budgeting.
During this class, I had the opportunity to enhance my skills further and apply my existing knowledge to new challenges. Below I've included the two Excel files, one from KNES 381 and the other is my class deadline tracker.
Video Analysis/Dartfish
Towards the end of classes we were introduced to a tool called Dartfish. Dartfish is a software platform designed for video analysis and performance enhancement in sports.
It allows individuals to capture, analyze, and share video footage to improve performance, coaching techniques, and game strategies. In class, we learned how to analyze both game footage
as well as individual footage which I have included below.